
2026's Side-Hustle Capitals, Ranked: Miami Wins on Volume, Loses on Value.
A New Report Ranks 30 U.S. Metros on Side-Hustle Work, Pay, and What That Pay Is Actually Worth
16 September, 2026

Side work can take many forms, from freelance design and consulting to delivery, home repairs, tutoring, and event services. But the size of a local solo-business economy does not necessarily show how much those businesses generate, what comparable work pays, or how far that pay goes once local prices are considered.
To identify which major U.S. metros have the strongest solo-business economies, Giggster analyzed 30 metropolitan areas, comparing where independent businesses are most concentrated and how their financial value differs across markets.
Using the latest available data for each measure, the report separately ranks each category before combining them into an overall Side-Hustle Capital Index and a broader picture of which metro areas appear the most concentrated for side work in 2026.
View our full methodology and breakdown here.
Key Takeaways
-
No metro dominates every measure of the solo-business economy. Miami leads for business density, New York City for average gross receipts, San Francisco for nominal pay, and Seattle for pay after local prices are considered.
-
High participation does not always translate into high business turnover. Half of the 10 highest-density metros, such as Orlando, Atlanta, Houston, Washington, and Tampa, are classified as Volume capitals, meaning they have above-median solo-business density but below-median average receipts.
-
The geography of the ranking changes depending on the question. Southern metros dominate the density ranking, taking seven of the top 10 positions, while New York City, San Francisco, Seattle, and Boston lead the main receipts and pay comparisons.
-
Local prices can outweigh a metro’s nominal wage advantage. Seattle overtakes San Francisco after adjustment, Detroit moves up five positions, and Miami falls to the bottom of the purchasing-power ranking despite leading the Side-Hustle Capital Index.
Miami Leads the Side-Hustle Capital Index
What the data says:
-
Miami ranks No. 1, with 2,214 nonemployer businesses per 10K residents and a score of 100 points. Its solo-business density is about 66% higher than Orlando’s and nearly 3.2 times Pittsburgh’s.
-
Southern metros dominate the highest-density markets. Seven of the top 10 are in the South, including Miami, Orlando, Atlanta, Houston, Tampa, Dallas, and Washington. Florida alone places three metros in the top 10.
-
Pittsburgh, Cincinnati, and Seattle record the lowest solo-business density among the 20 metros studied. Their index scores are approximately 31 and 34 points, respectively.
Four Types of Solo-Business Economies
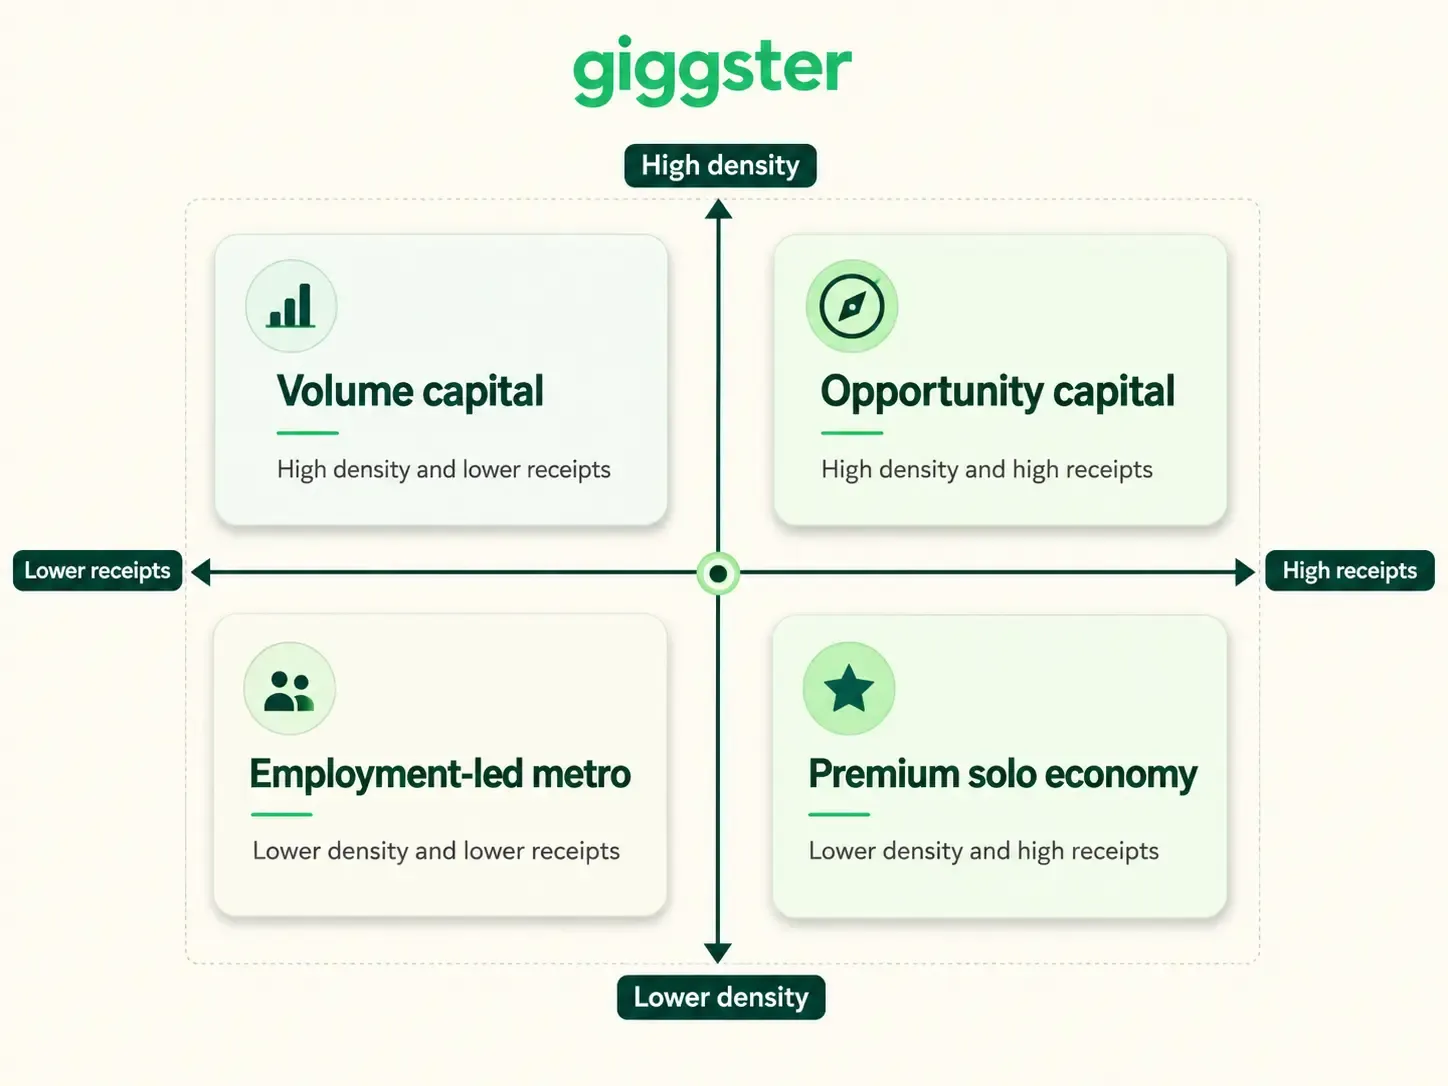
New York’s Solo Businesses Generate the Highest Average Receipts
What the data says:
-
New York City ranks first for average annual gross receipts, at $70.7K per nonemployer business. San Francisco follows at $70K, while Los Angeles ranks third at $69.3K.
-
Orlando and Atlanta have many solo businesses, but lower receipts per business. Orlando ranks second for solo-business density but last for average receipts, at $48.5K. Atlanta ranks third for density but second-lowest for receipts, at $50.2K.
-
Philadelphia and Seattle show the opposite pattern. Philadelphia ranks 24th for density but fifth for receipts, at $64.1K. Seattle ranks 28th for density but seventh for receipts, at $62.6K.
From Coders to Caterers: What 10 Hours of Side Work Can Pay
Side hustles are not a single labor market. Upwork’s 2026 side-hustle guide estimates that freelance writing and editing can pay roughly $15 to $40 an hour, graphic design about $15 to $35, web development and design about $15 to $30, and AI content support about $15 to $55. Other examples include social media management at approximately $14 to $35 an hour, bookkeeping at $11 to $25, tutoring at $20 to $40, and delivery work at roughly $21 an hour. (Upwork)
What the data says:
-
San Francisco offers the highest typical hourly pay, at $31.7. That equals an estimated $15.2K a year at 10 hours a week for 48 weeks. Seattle follows at $30.5 an hour, while Boston ranks third at $29.
-
Orlando and Tampa sit at the bottom of the pay ranking. Orlando’s benchmark is $21.4 an hour, or $10.3K a year - 15% below the 30-metro median. Tampa follows closely at $21.5 an hour and $10.3K a year.
-
Solo-business density and local pay do not always move together. Miami ranks first on the Side-Hustle Capital Index but fifth-lowest for typical hourly pay, at $22.7. Seattle ranks only 28th for solo-business density but second for pay, at $30.5 an hour.
Where Side-Hustle Pay Goes Furthest
What the data says:
-
Seattle moves into first place after local prices are considered. Its estimated annual pay of $14.6K has an adjusted value of $13.2K.
-
Detroit rises from 14th for nominal pay to ninth after adjustment, with a value of $12.1K. New York City moves in the opposite direction, falling from fourth to 10th as its $13.6K benchmark adjusts to $12.1K.
-
Miami has the lowest purchasing-power result, at $9.5K after local prices. Los Angeles and San Diego also fall into the bottom 10, with adjusted values of $11.4K, despite ranking 10th and 11th for nominal pay.
Key Terms
Nonemployer Business
A business with no paid employees that is subject to federal income tax. The figures count business records, not unique people, and include both possible side businesses and full-time independent firms.
Solo-Business Density
The number of nonemployer businesses per 10,000 metro residents. This is the primary metric used to rank the 30 metros.
Side-Hustle Capital Index
A score comparing each metro’s solo-business density with Miami, the study leader. Miami receives 100 points, and every other metro is measured relative to that benchmark.
Average Annual Gross Receipts per Nonemployer Business
The average yearly turnover generated by a metro’s nonemployer businesses before expenses and taxes. It is not profit, income, salary, or take-home pay.
Typical Hourly Pay and Estimated Annual Pay
Typical hourly pay is the median wage across eight selected BLS occupation groups. Estimated annual pay assumes 10 hours of work per week for 48 weeks. These are employee-wage benchmarks, not measured earnings for self-employed side-hustle workers.
Value After Local Prices
Estimated annual pay adjusted using the metro’s Regional Price Parity, where 100 represents the U.S. average price level. The result shows purchasing power in national-average-price terms.
You Might Also Be Interested In
Methodology
This study examined solo-business activity across 30 major U.S. metropolitan areas. The unit of analysis was the metropolitan statistical area, not the city proper. City names such as Miami, New York City, and Seattle are used as editorial labels for their corresponding metro areas.
Metros were matched across datasets using their five-digit Core-Based Statistical Area codes rather than names, which can differ between government releases. The 2025 Census population file was used only to define the study universe. All per-capita calculations use 2023 ACS metro population, matching the year of the Census business data.
The report contains one primary ranking and three separate supporting analyses:
-
Solo-business density and the Side-Hustle Capital Index
-
Average annual gross receipts per nonemployer business
-
Standardized local pay for selected types of side work
-
The purchasing-power value of that pay after local prices
The supporting receipt, wage, and price measures do not add points to or change the primary index.
Building the Side-Hustle Capital Index
The main ranking uses the 2023 Census Nonemployer Statistics metropolitan-area file. The data were filtered to NAICS 00 - Total for all sectors, leaving one all-industry record for each metro.
A nonemployer business is a business with no paid employees that is subject to federal income tax. It provides a consistent measure of solo-business activity, but it is not a direct count of people with side hustles. One person may operate more than one business, while one business may have more than one owner.
Raw business counts were converted into a population-adjusted measure:
Nonemployer businesses per 10,000 residents = Nonemployer businesses ÷ 2023 metro population × 10,000
This is the study’s primary ranking metric. Metros were ranked from highest to lowest using the underlying unrounded result.
Each metro’s density was then expressed relative to Miami, the study leader:
Side-Hustle Capital Index = Metro businesses per 10,000 residents ÷ Miami businesses per 10,000 residents × 100
Miami receives 100 index points. A score of 60 means that a metro has approximately 60% of Miami’s measured solo-business density. Scores are reported as index points, not as the percentage of residents with a side hustle.
The index is only a rescaling of solo-business density. It does not combine business receipts, occupational wages, Regional Price Parities, or any other supporting measure.
Calculating average annual gross receipts
Census Nonemployer Statistics reports total receipts in thousands of dollars. The study converted those figures into dollars before calculating the average:
Total receipts in dollars = Census total receipts × 1,000
Average annual gross receipts per nonemployer business = Total receipts in dollars ÷ Number of nonemployer businesses
This measure represents the average annual turnover reported by nonemployer businesses before expenses and taxes. It is not the same as income, earnings, salary, profit, or take-home pay.
The receipts ranking is separate from the Side-Hustle Capital Index. A metro can have high solo-business density but relatively low receipts per business, or lower density but comparatively high receipts.
Classifying four types of solo-business economies
Each metro was compared with the 30-metro medians for:
-
Nonemployer businesses per 10,000 residents
-
Average annual gross receipts per nonemployer business
The study medians were approximately 935.1 businesses per 10,000 residents and $57,173 in annual gross receipts per business.
Metros were placed into four descriptive groups:
-
Opportunity capital: Above the 30-metro median for both density and receipts
-
Volume capital: Above-median density but below-median receipts
-
Premium solo economy: Below-median density but above-median receipts
-
Employment-led metro: Below the median for both measures
These categories describe the structure of the data. They do not establish why people started businesses or whether local solo-business activity is driven by opportunity, necessity, unemployment, or other conditions.
Metro type does not affect the Side-Hustle Capital Index.
Measuring local side-work pay
The pay analysis uses May 2025 BLS Occupational Employment and Wage Statistics for broad occupation groups associated with common forms of side work.
The published cross-category benchmark includes eight groups:
-
Creative and media occupations
-
Professional services
-
Tech and digital occupations
-
Sales and real estate
-
Local services and care
-
Food and events
-
Home and repair services
-
Transport and delivery
The home and repair category combines the broader BLS Construction and Extraction and Installation, Maintenance, and Repair occupation groups.
Management, owners, office, and administrative support were excluded from the published cross-category metro benchmark. They remained available as research context but were not included in the eight-group median used for the ranking.
For each metro, the study calculated:
Typical hourly pay = Median of the eight selected occupation-group median hourly wages
The median was used instead of the mean so that one unusually high-paying occupation group would not determine the overall metro benchmark.
The hourly figure was then converted into a standardized annual amount:
Estimated annual pay = Typical hourly pay × 10 hours per week × 48 weeks
This represents 480 hours of work per year. The same schedule was used for every metro, allowing consistent comparisons between markets.
The annual figure is an illustrative benchmark, not a forecast of what a particular person will earn. Actual side-work income depends on hours, experience, demand, project availability, expenses, platform fees, and the specific job performed.
BLS OEWS measures wages paid to employees in nonfarm establishments and excludes self-employed workers. The results therefore, show what comparable types of work pay locally, not the observed earnings of self-employed side-hustle operators.
Upwork’s 2026 side-hustle pay ranges were used only as national narrative context. They were not blended with BLS data and did not affect any metro wage, annual-pay, affordability, or ranking calculation.
Adjusting pay for local prices
The purchasing-power analysis uses 2023 BEA Regional Price Parities, where 100 represents the average U.S. price level.
The standardized annual pay benchmark was adjusted as follows:
Value after local prices = Estimated annual pay ÷ (Regional Price Parity ÷ 100)
A metro with an RPP below 100 receives an upward adjustment because its overall consumer price level is below the national average. A metro with an RPP above 100 receives a downward adjustment.
The resulting figure expresses the standardized pay benchmark in national-average-price terms. It is not a measure of disposable income, savings, profitability, or the actual household budget of a side-hustle worker.
Nominal pay and cost-adjusted pay were ranked separately. The difference between those positions shows whether a metro rises or falls after local prices are considered.
Ranking and rounding rules
All calculations, comparisons, classifications, and rankings were based on the underlying unrounded values. Numbers were rounded only for presentation.
No composite score combines solo-business density, receipts, occupational pay, and purchasing power. Each section answers a separate question.
Things to keep in mind
Census Nonemployer Statistics count business tax records, not unique people. The results should not be interpreted as the percentage of residents with side hustles.
Nonemployer businesses include both possible side businesses and full-time independent operations. The Census data do not identify which businesses are secondary sources of income.
Average gross receipts are measured before operating expenses, taxes, platform fees, and other costs. They do not represent owner earnings or profit.
BLS OEWS excludes self-employed workers, even though self-employment is central to the side-hustle economy. Its wage data are used only as consistent local benchmarks for comparable work.
Regional Price Parities measure broad differences in consumer prices. They do not capture the circumstances of an individual household or the specific costs associated with operating a business.