Photography Tip: Understanding the Histogram
Histograms are a type of bar chart that visually represent the distribution of a particular piece of data. In photography histograms are useful because they make for a great way to visually represent the tonal (brightness) values in an image.
You’ll find an histogram on the screen at the back of your camera, and you’ll also find one in your RAW processor like Lightroom or Capture One, and then you also have access to an histogram in Photoshop. So really, you can use an histogram for the whole journey of an image, from shooting to RAW processing all to way to the final retouching.
For the back of the camera histogram, just navigate through the different info screens available and you’ll see one of them is a screen with an instagram.
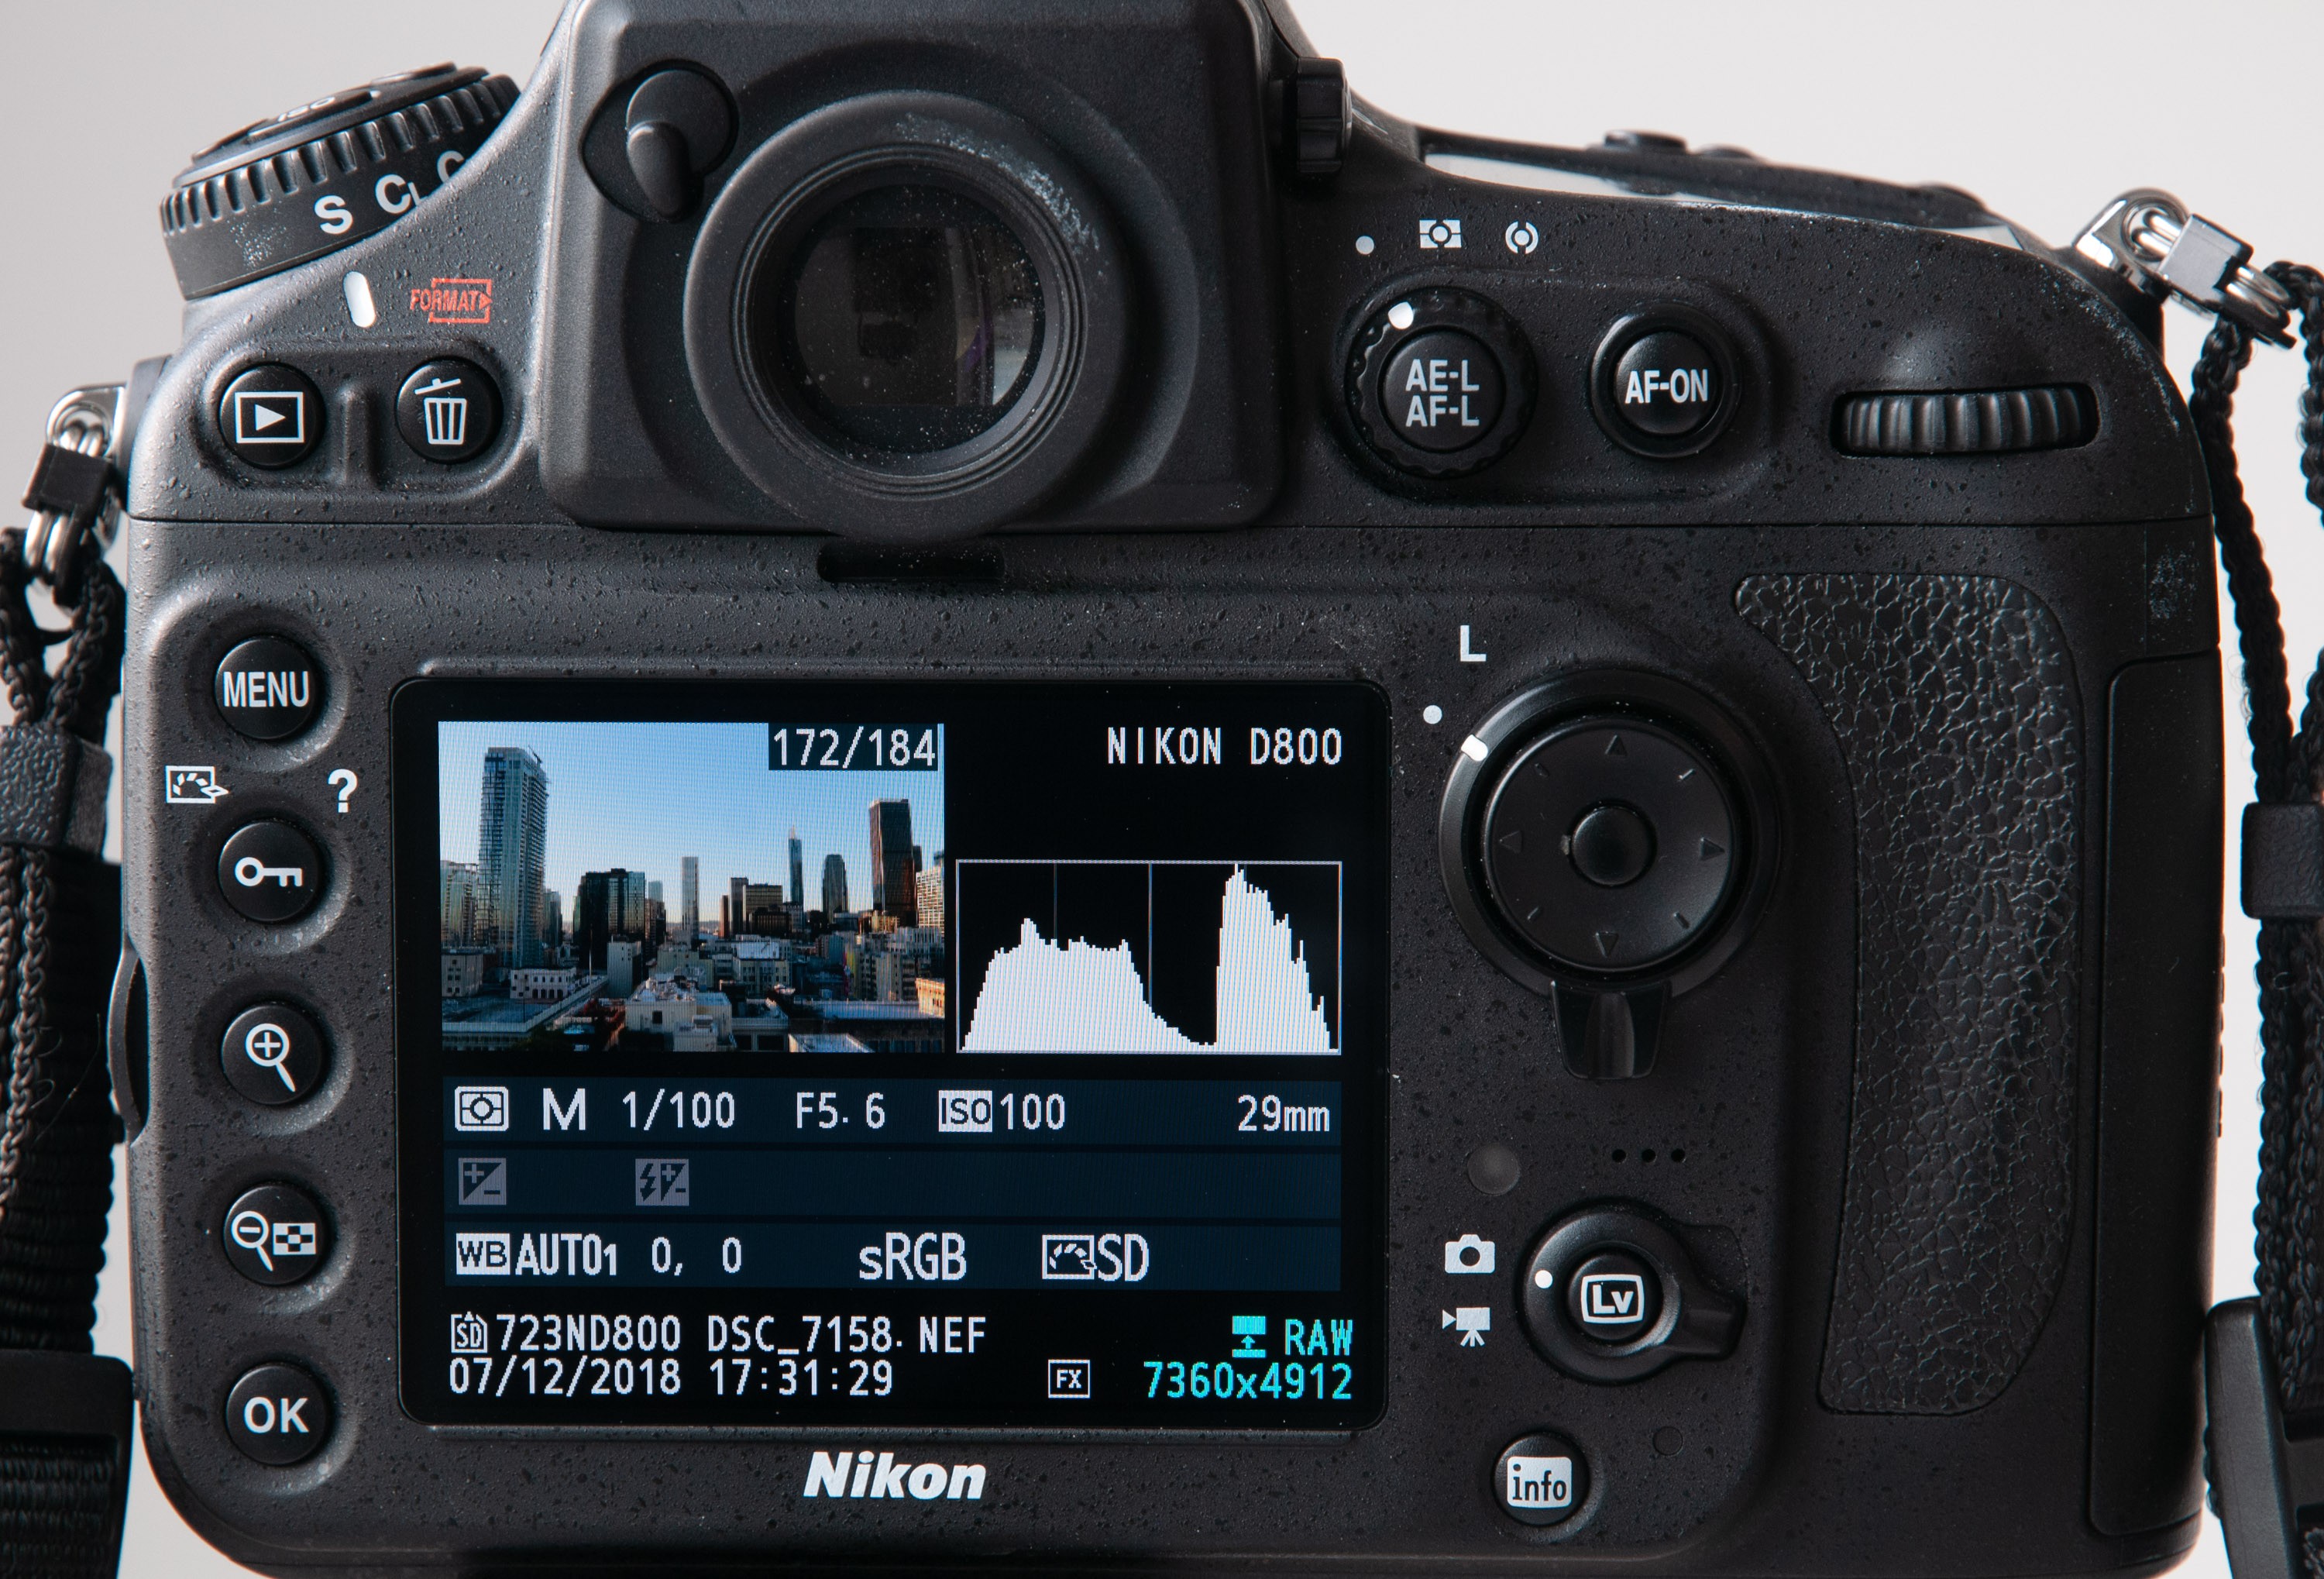
Here’s what a typical back of the camera histogram looks like:

On the left side of the X axis are the dark tonal values and on the right side are the bright tonal value. Values totally to the left are pure black, value totally to the right are pure white, and value right in the middle are mid-gray.
Why Use an Histogram?
The image you see at the back of the camera is not a reliable visual reference to know if your image has been exposed correctly. There are 3 main reasons why that is:
- You could be shooting in a very bright area and the glare on the screen makes it almost impossible to see the picture correctly.
- The image you see is very small, so it can be really hard to tell if things are exposed correctly, even when you zoom in.
- Your camera may be set to show you an image in the back of the camera that’s more punchy than the actual image you shot. You can tweak the picture style shown to get a more true representation, but it still won’t be perfect.
Histograms, on the other hand, don’t lie and will accurately show you the lightness/tonal value distribution throughout your image.
Reading an Histogram
The concepts behind histograms are pretty simple to understand, but it still takes practice and experience to be able to read an histogram and know right away if your exposure is right or if it should be adjusted.
It’s not true that good histograms have most of the total values near the center and then tapper down towards both the darker and brighter values. That’s only true if your scene averages down to mid-gray, but it’s not true at all for dark/low-key scenes, or bright/high-key scenes.
So yes, if you look at the scene you’re photographing and you feel like overall there’s darks, grays and lights that are all about proportional, then an histogram for the right exposure will be pretty distributed throughout with most of the distribution in the middle. But if you’re taking a photograph of a dark scene and expect darks to stay dark, then you histogram should have most of its values skewed to the left, or else it means that your shot is overexposed. And it’s similar for high-key shots, where you should see the histogram being skewed to the right.
Here’s an example of an image and its histogram where we expect the value to average to gray, so having most of the tonal values towards the middle makes sense:

And here’s an example where the histogram is skewed to the right because most of the values are pretty bright:

What About the Peaks?
Peaks throughout the histogram are totally normal and nothing to worry about. They just mean that you have a lot of a certain tonal/brightness value. The only peaks you’ll really need to watch for are the ones on either ends of the histogram. See the next section about clipping for more about that.
Avoid Clipping Using an Histogram
So when there’s a bar at either ends of the histogram, it means that you’re clipping and some of the tonal values are pure black or pure white, depending on which end of the histogram you see that bar. Most of the time you’ll want to avoid clipping, because it means that the values are lost and won’t have any details.
There are still cases where clipping makes total sense and is actually expected though. Here are two example scenarios:
- You’re taking photos in front of a black or white seamless/wall and you actually want the background to be pure black or pure white.
- The range of tonal values in your photograph is so wide that your camera can’t possibly record all the total values that your eye sees because of the limited dynamic range capabilities of the camera. For example, if you take a landscape photo where the sky is really bright and the rest of the scene is much darker, it may be Ok to have some of the values in the sky be pure white, to prevent having the rest of the scene majorly underexposed. These situations are when HDR photography becomes really useful.
Here’s an example of a photo and its histogram where there’s some clipping in the highlights and some of the colors have gone to pure white:

My Histogram is Wrong, Now What?
So you’re looking at the histogram and realizing that the values don’t really make sense for what you’re shooting, or you’re clipping and want to avoid that. It’s easy to fix, just adjust your exposure up or down and take another photograph. You’ll see that the histogram will have the values nudged either to the left or the right, depending on whether you decreased or increased the exposure.
RGB Histograms
The default white histogram is called a luminosity histogram and is for the overall brightness values, but cameras and RAW processing softwares can also show a different histogram for each of the 3 color channels: red, green and blue. This can become useful to make sure that the colors in the shot look like what they should. If, for example, you’re not expecting a lot of blue tones in the shadows, but the histogram begs to differ, then you know that you need to make some adjustments, especially when it comes to your white balance in this case.
Here’s an example where we see the RGB histograms:

Histogram in Adobe Photoshop
You can see an histogram in Photoshop when you add a Curves or a Level adjustment, which is a combined histogram of the RGB values. As for a luminosity histogram for tonal values like the one at the back of the camera, you can get one by going to Window > Histogram. As you make changes to the brightness of your image, you’ll see the luminosity histogram will reflect the changes, this way you can also watch for clipping.